
I own a couple of tape deck analyzers, that help me set levels and frequency response settings within each tape deck that I service. One analyzer is the Nakamichi T-100 unit that dates from the mid 1980’s. The other is a Soundtech 1510A analyzer, which has a built in CRT display to plot frequency response curves for the record and playback of each channel.
 Soundtech 1510A

Nakamichi T-100
Both of those are test equipment pieces to test/calibrate tape decks with. They are hard to find, and mine aren’t for sale! I post a frequency response chart to show the recording and playback quality of the deck.
For 3 head decks, I feed the analyzer signal into the deck, and then plot the output of the playback head to the CRT display. This provides an accurate measurement from 20Hz to beyond 20Khz. A typical reel to reel in excellent condition should be relatively flat in response from about 40Hz to 20Khz at 7 ½ IPS, and usually around 50Hz to 17 or 18Khz at 3 ¾ IPS. A well aligned deck in the semi pro or pro range should have a flat response to past 20Khz at 15 IPS and 30 or 60IPS.
Every deck will have some frequency response deviation from a flat line as shown in this image, but keep in mind that specifications for decks are always given as +/-3db. So, even if a tape deck is down by 3db at 50Hz, and has a slight boost at 10Khz of 3db, the deck is still within spec of +/- 3db. The overall frequency response will depend on:
- Head condition
- Tape head alignment
- Quality of record and playback electronics
- Condition of components of the record and playback electronics.
- Brand of tape deck.
By far the most consistent/flattest frequency response is from a Revox or Studer deck. These decks are typically flat +/- 1db between 40Hz and 20Khz at 7 ½ IPS. This results in a sound coming from the tape deck that is very close to the incoming signal that is recorded. Depending on what you want to do with your tape machine, that may or may not be desired.
 (pix 8837)
Pix 8837 shows the typical flat frequency response of a Studer A807. While it starts to roll off at roughly 50Hz and below, it is almost ruler flat to about 23Khz, well past the point of human hearing. Some recording engineers call this flat frequency response as being too ‘clinical’, and prefer a less flat frequency response as given by most Japanese decks and by the highly regarded Ampex ATR102, one of the most desired mastering decks.
 (pix 8959)
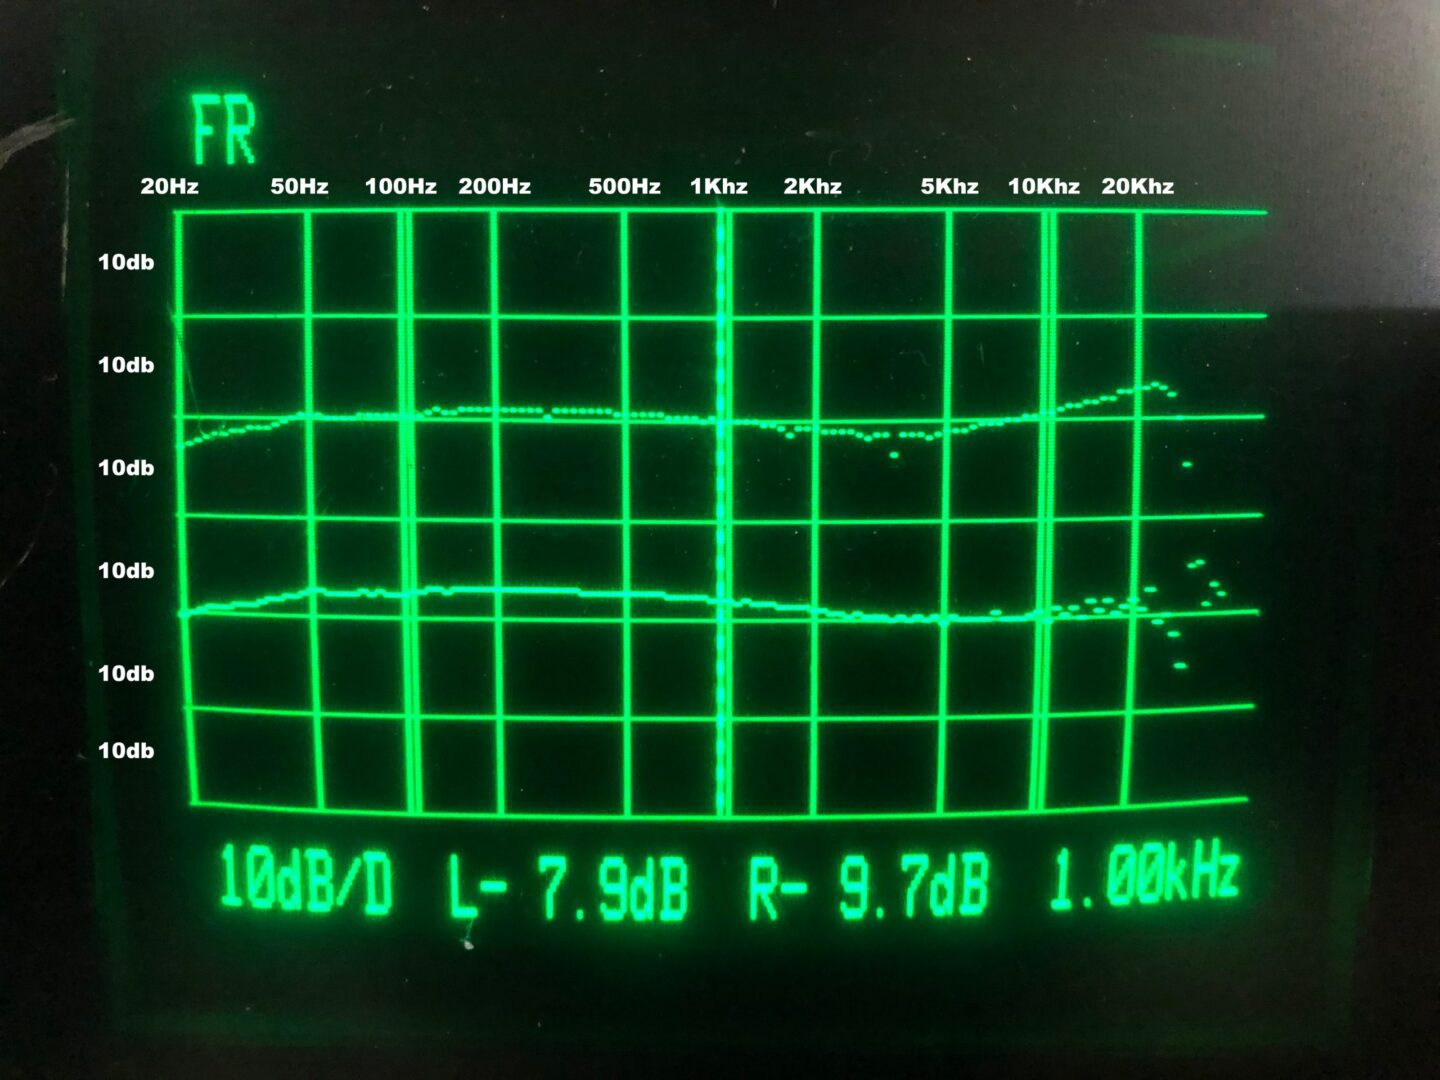
Take a look at picture 8959. This response was taken from a Tascam TSR-8 ½” 8 track unit, and it shows a slight rise around 50hz, with a slight reduction in high frequency response above 5Khz. That rise in the bass frequencies will give a bass drum or bass guitar a larger, slightly emphasized sound. For recording engineers working in a small home studio, this can have audible benefits to a final recording. The slight dropoff in the high end can generally be tweaked flat by adjusting the bias and eq trimpots within a tape deck. It could also mean that there is some head wear, which can also result in a dropoff at the higher frequencies.
Assuming that heads are aligned and in good shape, the bias and eq settings within decks can be used to distort the frequency response, and it’s not uncommon for me to get a deck in where someone without the proper knowledge to align tape decks ends up with a result of that of picture 9036. One channel has a nice flat frequency response, the other channel has massive high frequency dropoff, starting at around 8Khz. This can be due to worn or misaligned heads, in the case shown, someone had gotten into the internal trimpots to ‘try and make the deck sound better’.
If you don’t have the knowledge or proper tools and test tapes to set the alignment or internal trimpots, it’s best not to try and attempt the calibration of a deck yourself.